Service · INF
Infographics & Data Design
Complex information turned into clear, shareable visuals people actually read.
Why it matters
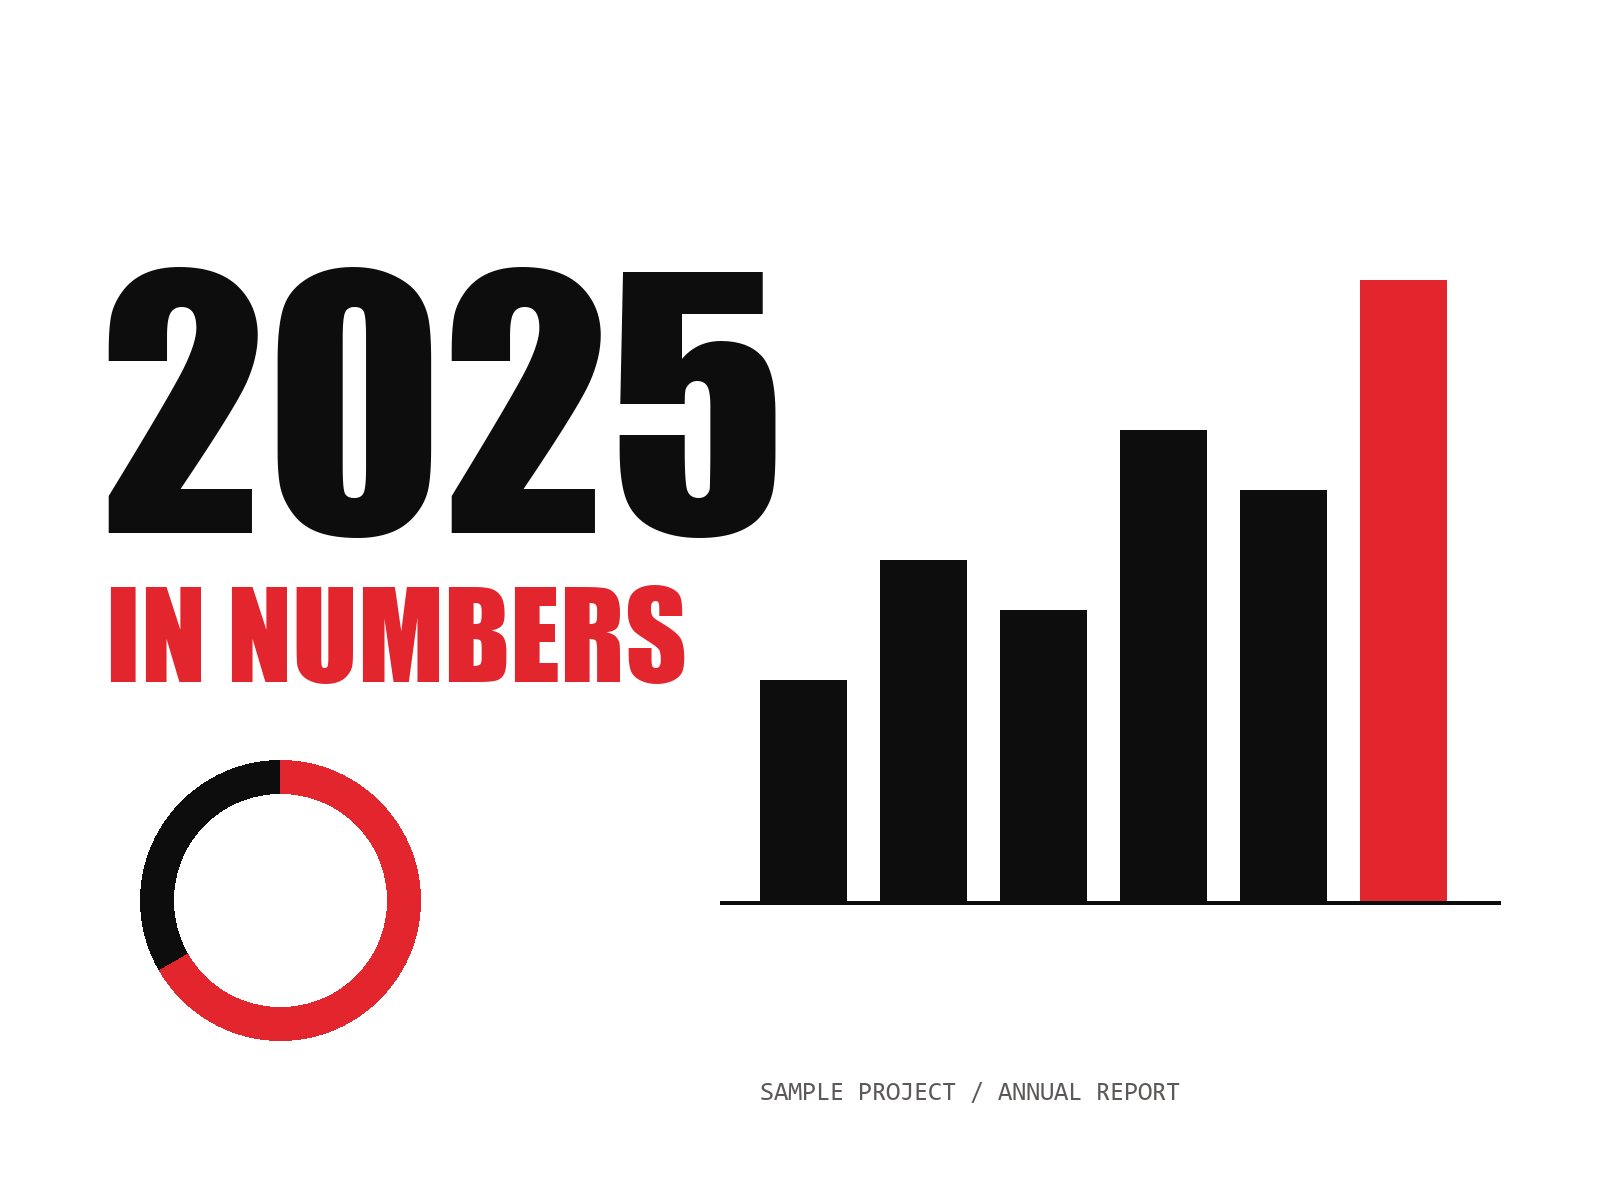
People skim words but stop for a good visual. We turn your data, processes and reports into infographics, charts and explainer graphics that are easy to understand, on brand and built to be shared, printed or presented.
What's included
- 01Social media infographics
- 02Annual and company report design
- 03Presentation and pitch decks
- 04Charts and data visualisation
- 05Process and explainer graphics
- 06Animated infographics
- 07Posters and print infographics
What you get
Built to perform.
Data that reads at a glance
Graphics sized for every platform
Editable source files
A consistent visual style across reports
How we work
The ADIB system.
Five connected stages, not five disconnected hand-offs. Every project moves through the same system, end to end.
-
Stage 01/05
Strategy
Understand the business and the market.
We study your customers, competitors and goals, then agree on what success looks like and how we will measure it.
- Discovery session
- Competitor review
- Success metrics
-
Stage 02/05
Design
Shape the experience around the user.
Wireframes, visuals and copy that put the right message in front of the right person, approved by you before we build.
- Wireframes
- Visual design
- Copy direction
-
Stage 03/05
Development
Engineer it to perform, not just look good.
Built mobile-first, fast on South African data connections, secure and easy for your team to update.
- Responsive build
- Speed and SEO setup
- Testing on real devices
-
Stage 04/05
Marketing
Put it in front of the right audience.
Search, social and paid campaigns that bring qualified visitors to what we built.
- Launch campaign
- Ads and SEO
- Tracking and analytics
-
Stage 05/05
Growth
Measure, refine and compound results.
Monthly reporting and improvements. Most of our best work happens in month six, not week one.
- Monthly reports
- Testing and tuning
- Quarterly planning
What do you need from me?
Your data or content in any format: a spreadsheet, a report, notes or a call with the right person. We shape the story from there.
Can you animate an infographic?
Yes. We create short animated versions for social media, websites and presentations.
Will it match my brand?
Always. We work within your brand guidelines, or create a visual style if you do not have one yet.